Find out which events really deliver results — and prove it to your partners
As a DMO or city marketing organisation, you collect events, venues and routes throughout the year. You enhance them with descriptions, photos and categories. You publish them on your website. And then? Then things go quiet.
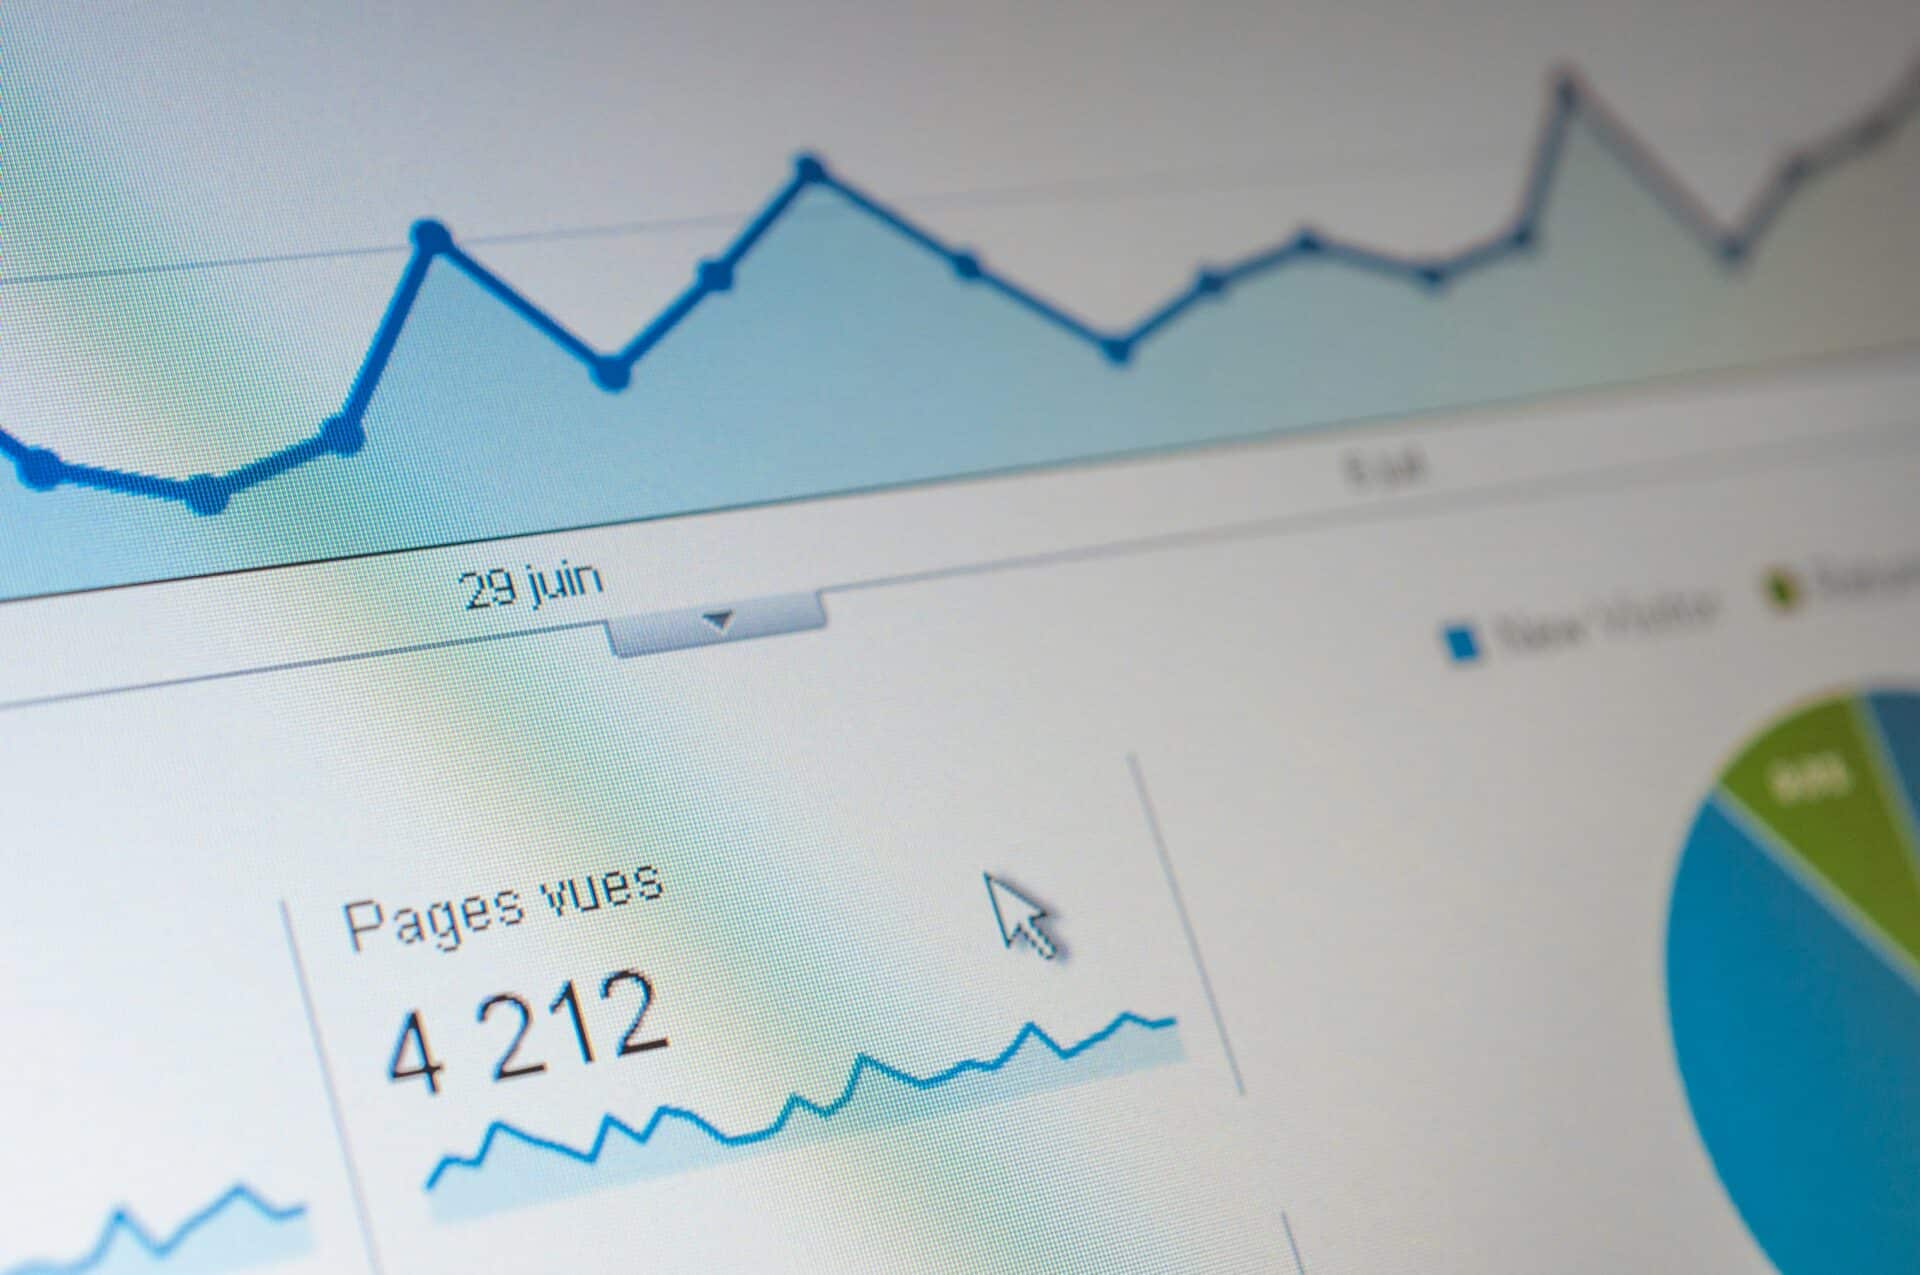
You publish hundreds of events. But what do they deliver?
You know visitors come to your website. Google Analytics shows pageviews. But pageviews don’t tell you whether someone actually read the page. Whether the visitor found the ticket link. Whether the photo gallery was viewed. Or whether the event was shared with friends.
And when an event organiser asks: “What did it deliver having our festival on your website?” — you don’t really have a good answer.
The pain: reporting without data
Does this sound familiar?
- Your client wants to see results. The municipality, the province, management or the board asks for reports. But all you can show is pageviews — and those say very little about actual impact.
- Partners and organisers want proof. A festival organiser or museum operator wants to know whether it’s worth submitting events. Without concrete data, that’s a difficult conversation.
- Your editorial team works on gut feeling. Which events deserve a better description? Which categories are missing content? Which pages underperform? Without engagement insights, every choice is a guess.
- You can’t demonstrate your value. In every conversation you want to prove that your platform works. But “we had X pageviews” is increasingly unconvincing.
The solution: measure what matters
Engagement tracking and smart content optimisation for DMOs
Event Connectors has developed engagement tracking that measures exactly how visitors interact with your event pages. Not just whether someone visits, but what they actually do.
What we measure
- Active reading time. How long someone was genuinely reading. Tab in the background? Doesn’t count.
- Scroll depth. Did the visitor view the entire page, or did they only read the first paragraph and leave?
- Click behaviour. Did someone click on the photo gallery? On the map? On the ticket link?
- Sharing. Was the event shared via WhatsApp, Facebook or email?
- Click-throughs. Did the visitor click through to the ticket shop or the organiser’s website?
- Returning visitors. Did someone come back to the same page later?
Every event receives an engagement score from 0 to 100. At a glance you can see what performs and what doesn’t.
What we don’t measure
No names, no email addresses, no IP addresses, no cookies. The tracker is fully GDPR-compliant and works without a cookie banner. Privacy-friendly by design.
What does it deliver?
1. Reports that impress
Imagine telling a festival organiser: “Your festival was viewed 3,200 times. Visitors read for an average of 45 seconds. 62% scrolled to the ticket link and 28% clicked through to your ticket shop.”
That’s a very different story from: “There were pageviews.”
With engagement data you substantiate the value of your platform to partners, clients and funding bodies. Concrete, measurable and convincing.
2. An editorial team that works data-driven
The dashboard gives your editorial team concrete recommendations:
- “Give it a boost” — Events that score well but deserve more reach. Feature them on the homepage, at the top of the events calendar or in your newsletter.
- “Hidden gems” — Few visitors, but those who come read extensively and click through. More promotion could make a big difference here.
- “Needs attention” — Many visitors, but they drop off quickly. The copy or the photos could be improved.
- “Publish this” — Topics that visitors are searching for, but for which you have no content yet.
3. Better content with the writing assistant
Knowing that an event page underperforms is step one. The next step: improving the content. For this, Event Connectors has developed the writing assistant.
The writing assistant helps your editorial team to:
- Sharpen titles that grab attention
- Write short descriptions that entice visitors to click through
- Improve long descriptions so visitors read longer and click through to tickets or the organiser more often
- Generate SEO-optimised page titles and meta descriptions that rank well in Google and achieve a high click-through rate
The combination is powerful: engagement tracking shows where things can improve, the AI writing assistant helps you actually make it better. Measure, improve, measure again — a continuous cycle that makes your content stronger over time.
4. Discover what you’re missing
By linking search queries to your offering, you can see what visitors are looking for but can’t find. This helps you discover opportunities: a category with high demand but little supply, or a region where events are lacking. Data that helps you collect more effectively.
5. Prove your value
When approaching a new partner or applying for funding, you can demonstrate what your platform delivers. Not with vague promises, but with hard engagement figures per event, per category and per partner. That strengthens your position considerably.
From collecting to accountability
Most DMOs are good at the first part of the job: collecting and publishing events. But the step towards analysing, interpreting and reporting often remains undone — simply because the tools are missing or too expensive.
With engagement tracking and the writing assistant, Event Connectors closes that loop:
| Step | What you do | What you need |
|---|---|---|
| Collect | Gather and enter events, locations and routes | Our tool, feeds, scrapers, manual entry |
| Enrich | Write copy, add photos, categorise | Writing assistant for titles, descriptions and SEO |
| Distribute | Publish on your website and channels | Publication module |
| Analyse | Measure how visitors interact with your content | Engagement tracking |
| Report | Share results with partners and clients | Engagement dashboard and exports |
| Optimise | Improve content based on data | Writing assistant + engagement scores |
What do you need to do?
Almost nothing. We add a small script to your website — smaller than a single photo. Your web developer can do it in fifteen minutes. Using WordPress? It’s even simpler with our ready-made integration.
The data appears in the dashboard your editorial team already uses. No new system, no extra login, no cookie banner.
Summary
| Without | With Event Connectors engagement tracking |
|---|---|
| Pageviews only | Reading time, scroll depth, clicks and shares |
| Reporting on gut feeling | Concrete figures per event and per partner |
| Improving content without direction | Writing assistant with SEO optimisation |
| “We had X visitors” | “28% clicked through to the ticket shop” |
| Cookie banner required | No cookies, fully GDPR-compliant |
Engagement tracking & analytics and the AI Writing Assistant are available for all Event Connectors clients. Both modules are available as add-ons. Want to know what it can mean for your organisation? Get in touch via info@eventconnectors.nl.
